
Read the income statement
Review revenue, expenses and income for a selected date range.
- Who can do this
- Owners, or people with View financial reports
- Where
- Reports, then Income statement
On this page
The income statement shows revenue and expenses for a period. The report body is headed Statement of Operations. You need View financial reports permission, or owner access.
Generate the report
- In General, open Reports. In Nonprofit, use Other reports under Nonprofit, Reports, or the shared Reports group when shown.
- Select Income statement.
- Enter From Date.
- Enter To Date.
- Select Generate.
The initial range runs from your current fiscal year's start through today. Figures use posted activity dated within the range, including both endpoints. Year-end closing entries and their reversals are excluded from activity.
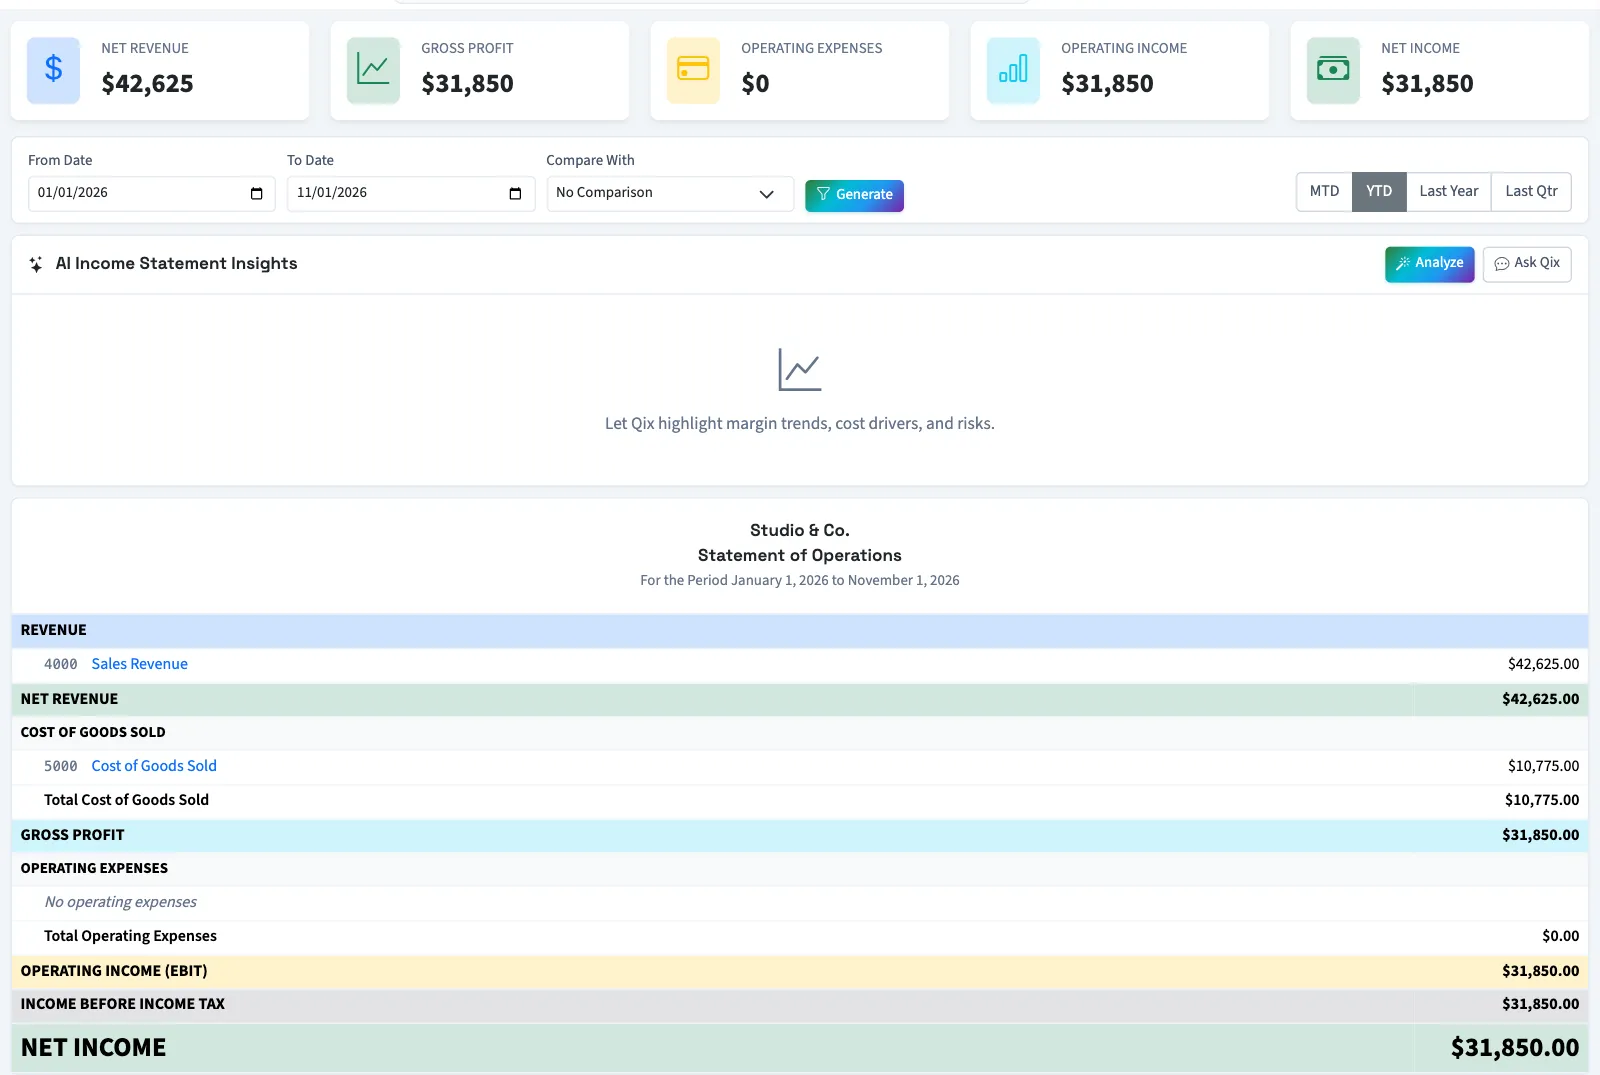
Read the totals
| Figure | How QixCount calculates it |
|---|---|
| Net Revenue | Operating revenue minus sales discounts and returns. |
| Gross Profit | Net revenue minus cost of goods sold. |
| Operating Expenses | Expenses grouped as operating expenses by account subtype. |
| Operating Income | Gross profit minus operating expenses. |
| Net Income | Operating income plus other income, minus other expenses and tax expense. |
In Nonprofit, Change in net assets replaces Net Income on screen. Gross Profit is hidden when there is no cost-of-goods line. The PDF uses the same Nonprofit wording.
Account subtypes determine where amounts appear. Rows with no activity are omitted. General includes inactive revenue and expense accounts with activity in the period; Nonprofit includes accounts with posted Nonprofit activity even when an account is inactive.
In General, negative account activity reduces its total. Check unusual balances or reversals in the general ledger when comparing results.
The summary cards round to whole dollars. The statement's account rows show cents. Margin percentages divide gross profit, operating income or net income by net revenue; they show N/A when net revenue is not positive.
Compare or request an explanation
Use Compare With for Previous Period or Same Period Last Year, then select Generate. Each account row then shows its amount for the earlier dates, and totals include every account. An account with activity only in the earlier dates still gets a row, showing no amount for the current dates. The PDF and Excel exports show the same comparison.
Select Analyze to request Qix's explanation of the applied dates and comparison. Ask Qix opens the chat.
What happens next
Use the cash flow statement to review cash movement for the same dates. Net income and cash movement measure different things.